Learn how to apply enterprise-grade network segmentation practices to your homelab using OPNsense, enhancing security and minimizing risks.
Introduction to Network Segmentation
Picture this: you’re troubleshooting a slow internet connection at home, only to discover that your smart fridge is inexplicably trying to communicate with your NAS. If that sounds absurd, welcome to the chaotic world of unsegmented home networks. Without proper segmentation, every device in your network can talk to every other device, creating a sprawling attack surface ripe for exploitation.
Network segmentation is the practice of dividing a network into smaller, isolated segments to improve security, performance, and manageability. In enterprise environments, segmentation is a cornerstone of security architecture, but it’s just as critical for home networks—especially if you’re running a homelab or hosting sensitive data.
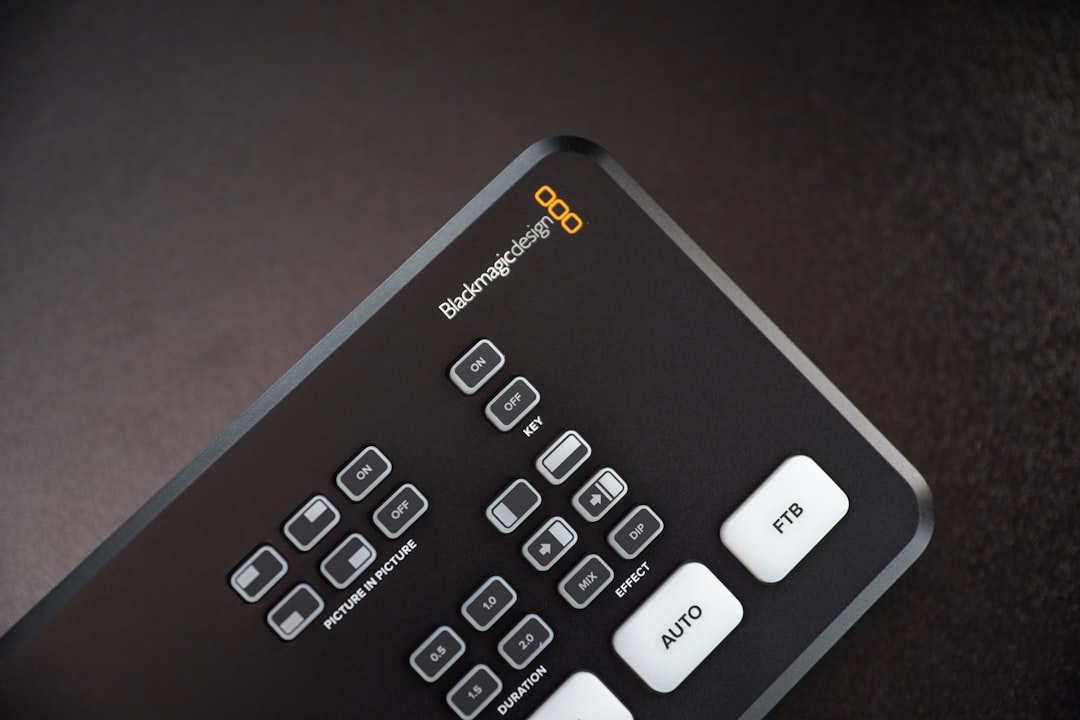
Enter OPNsense, a powerful open-source firewall and routing platform. With its robust feature set, including support for VLANs, advanced firewall rules, and traffic monitoring, OPNsense is the perfect tool to bring enterprise-grade network segmentation to your home.
Segmentation not only reduces the risk of cyberattacks but also improves network performance by limiting unnecessary traffic between devices. For example, your NAS doesn’t need to communicate with your smart light bulbs, and your work laptop shouldn’t be exposed to traffic from your gaming console. By isolating devices into logical groups, you ensure that each segment operates independently, reducing congestion and enhancing overall network efficiency.
Another key benefit of segmentation is simplified troubleshooting. Imagine a scenario where your network experiences a sudden slowdown. If your devices are segmented, you can quickly identify which VLAN is causing the issue and narrow down the problematic device or service. This is particularly useful in homelabs, where experimental setups can occasionally introduce instability.
💡 Pro Tip: Use OPNsense’s built-in traffic monitoring tools to visualize data flow between segments and pinpoint bottlenecks or anomalies.
Enterprise Security Principles for Home Use
When adapting enterprise security principles to a homelab, the goal is to minimize risks while maintaining functionality. One of the most effective strategies is implementing a zero-trust model. In a zero-trust environment, no device is trusted by default—even if it’s inside your network perimeter. Every device must prove its identity and adhere to strict access controls.
VLANs (Virtual Local Area Networks) are the backbone of network segmentation. Think of VLANs as virtual fences that separate devices into distinct zones. For example, you can create one VLAN for IoT devices, another for your workstations, and a third for your homelab servers. This separation reduces the risk of lateral movement—where an attacker compromises one device and uses it to pivot to others.
⚠️ Security Note: IoT devices are notorious for weak security. Segmentation ensures that a compromised smart device can’t access your critical systems.
By segmenting your home network, you’re effectively shrinking your attack surface. Even if one segment is breached, the damage is contained, and other parts of your network remain secure.
Another enterprise principle worth adopting is the principle of least privilege. This means granting devices and users only the minimum access required to perform their tasks. For instance, your smart thermostat doesn’t need access to your NAS or homelab servers. By applying strict firewall rules and access controls, you can enforce this principle and further reduce the risk of unauthorized access.
Consider real-world scenarios like a guest visiting your home and connecting their laptop to your Wi-Fi. Without segmentation, their device could potentially access your internal systems, posing a security risk. With proper VLAN configuration, you can isolate guest devices into a dedicated segment, ensuring they only have internet access and nothing more.
💡 Pro Tip: Use OPNsense’s captive portal feature to add an extra layer of security to your guest network, requiring authentication before granting access.
Setting Up OPNsense for Network Segmentation
Now that we understand the importance of segmentation, let’s dive into the practical steps of setting up OPNsense. The process involves configuring VLANs, assigning devices to the appropriate segments, and creating firewall rules to enforce isolation.
Initial Configuration
Start by logging into your OPNsense web interface. Navigate to Interfaces → Assignments and create new VLANs for your network segments. For example:
# Example VLAN setup
vlan10 - IoT devices
vlan20 - Workstations
vlan30 - Homelab servers
Once the VLANs are created, assign them to physical network interfaces or virtual interfaces if you’re using a managed switch.
After assigning VLANs, configure DHCP servers for each VLAN under Services → DHCP Server. This ensures that devices in each segment receive IP addresses within their respective ranges. For example:
# Example DHCP configuration
VLAN10: 192.168.10.0/24
VLAN20: 192.168.20.0/24
VLAN30: 192.168.30.0/24
Creating Firewall Rules
Next, configure firewall rules to enforce isolation between VLANs. For example, you might want to block all traffic between your IoT VLAN and your workstation VLAN:
# Example firewall rule
Action: Block
Source: VLAN10 (IoT)
Destination: VLAN20 (Workstations)
Don’t forget to allow necessary traffic, such as DNS and DHCP, between VLANs and your router. Misconfigured rules can lead to connectivity issues.

                💡 Pro Tip: Test your firewall rules with a tool like ping or traceroute to ensure devices are properly isolated.

One common pitfall during configuration is forgetting to allow management access to OPNsense itself. If you block all traffic from a VLAN, you may inadvertently lock yourself out of the web interface. To avoid this, create a rule that allows access to the OPNsense management IP from all VLANs.

                ⚠️ Warning: Always double-check your firewall rules before applying them to avoid accidental lockouts.

Use Cases for Home Network Segmentation
Network segmentation isn’t just a theoretical exercise—it has practical applications that can significantly improve your home network’s security and usability. Here are some common use cases:
Separating IoT Devices
IoT devices, such as smart thermostats and cameras, are often riddled with vulnerabilities. By placing them in a dedicated VLAN, you can prevent them from accessing sensitive systems like your NAS or workstations.
For example, if a vulnerability in your smart camera is exploited, the attacker would be confined to the IoT VLAN, unable to access your homelab or personal devices. This segmentation acts as a safety net, reducing the impact of potential breaches.
Creating Guest Networks
Guest networks are essential for maintaining privacy. By segmenting guest devices into their own VLAN, you ensure that visitors can access the internet without compromising your internal systems.
Additionally, you can apply bandwidth limits to guest VLANs to prevent visitors from consuming excessive network resources. This is particularly useful during gatherings where multiple devices may connect simultaneously.
Isolating Homelab Services
If you’re running a homelab, segmentation allows you to isolate experimental services from your production environment. This is particularly useful for testing new configurations or software without risking downtime.

                ⚠️ Warning: Avoid using default VLANs for sensitive systems. Attackers often target default configurations as an entry point.

Another use case is isolating backup systems. By placing backup servers in their own VLAN, you can ensure that they are protected from ransomware attacks that target production systems. This strategy adds an extra layer of security to your disaster recovery plan.
Monitoring and Maintaining Your Segmented Network
Once your network is segmented, the next step is monitoring and maintenance. OPNsense provides several tools to help you keep an eye on traffic and detect anomalies.
Traffic Monitoring
Use the Insight feature in OPNsense to monitor traffic patterns across VLANs. This can help you identify unusual activity, such as a sudden spike in traffic from an IoT device.
For example, if your smart thermostat starts sending large amounts of data to an unknown IP address, Insight can help you pinpoint the issue and take corrective action, such as blocking the device or updating its firmware.
Firewall Rule Audits
Regularly review your firewall rules to ensure they align with your security goals. Over time, you may need to update rules to accommodate new devices or services.

                💡 Pro Tip: Schedule monthly audits of your OPNsense configuration to catch misconfigurations before they become problems.

Best Practices
Here are some best practices for maintaining a secure segmented network:
- Document your VLAN and firewall rule configurations.
- Use strong passwords and multi-factor authentication for OPNsense access.
- Keep OPNsense updated to patch vulnerabilities.
- Regularly back up your OPNsense configuration to prevent data loss during hardware failures.
Advanced Features for Enhanced Security
Beyond basic segmentation, OPNsense offers advanced features that can further enhance your network’s security. Two notable options are intrusion detection systems (IDS/IPS) and virtual private networks (VPNs).
Intrusion Detection and Prevention
OPNsense includes built-in IDS/IPS capabilities through Suricata. These tools analyze network traffic in real-time, identifying and blocking malicious activity. For example, if an attacker attempts to exploit a known vulnerability in your IoT device, Suricata can detect the attack and prevent it from succeeding.
VPN Configuration
For a comprehensive guide, see our Secure Remote Access for Your Homelab tutorial.
Setting up a VPN allows you to securely access your home network from remote locations. OPNsense supports OpenVPN and WireGuard, both of which are excellent choices for creating encrypted tunnels to your network.
💡 Pro Tip: Use WireGuard for its speed and simplicity, especially if you’re new to VPNs.
🛠️ Recommended Resources:
Tools and books mentioned in (or relevant to) this article:
Conclusion and Next Steps
Network segmentation with OPNsense is a powerful way to enhance the security and functionality of your home network. By isolating devices into distinct VLANs and enforcing strict firewall rules, you can minimize risks and create a more manageable network environment.
If you’re ready to take your homelab security to the next level, explore advanced OPNsense features like intrusion detection (IDS/IPS) and VPN configurations. The OPNsense community is also a fantastic resource for troubleshooting and learning.
Key Takeaways:
- Network segmentation reduces attack surfaces and prevents lateral movement.
- OPNsense makes it easy to implement VLANs and firewall rules.
- Regular monitoring and maintenance are critical for long-term security.
- Advanced features like IDS/IPS and VPNs provide additional layers of protection.
Have you implemented network segmentation in your homelab? Share your experiences or questions—I’d love to hear from you. Next week, we’ll dive into setting up intrusion detection with OPNsense to catch threats before they escalate.
📋 Disclosure: Some links in this article are affiliate links. If you purchase through these links, I earn a small commission at no extra cost to you. I only recommend products I’ve personally used or thoroughly evaluated. This helps support orthogonal.info and keeps the content free.